What metrics should we measure for success in Google Analytics?
 (1.)
(1.)There are many tools available on the market that helps to analyze the traffic on our websites. Although the most popular and also adequate one is as is previous examples the one available by Google - Google Analytics.
Thanks to the tool we can measure the visitor information, such as:
- What time customers/viewer arrives
- How long they stay
- What do they look at/ What they are searching for
- How long do they stay
- Demographics (gender, age, location, language)
- New/Regular visitor
- Access through PC or Phone
I have 3 websites registered on y Google Analytics.
One is my current Photography website that I use to promote my job.
Second one is the blog that we crated on the DBS Digital Marketing course here.
The third one is the new website that we created lately on the course, so I will rather concentrate on the first two, as I have much more data to compare there.
I will start from my personal website, as per having more data there. The website "martalara.com" is already almost 1 year old, so there is quite much data to present and compare.
To begin - the first data - the number of viewers through months.

Below I share more detailed view:

The next slide shows the language of the viewers of my page. As I am based in Poland, the highest view was in Polish language, later English (friends) and Spanish (friends and family). After that Russian and German (I speak also those languages and have friends from countries where people speak those languages). Moreover I was often travelling to Spain last year, so as I was promoting my business there and the views (which are actually lower than I thought) are also presented on the report. The next slide shows a bit more regarding the Polish and Spanish promotion and my presence in these countries (views from the country perspective):


Highest numbers of the views from the cities that I lived in (and that I have friends/customers):

The next important indicator, which can help me to develop the website is from what type of operational system- therefore - device (PC or mobile) people were checking my website - apparently, the highest views number was done from the mobile with Android (god, that my web has good mobile adjusted design;):

The following two factors I find as one of the most important indicators: the age of the viewers and also the gender (majority - 20%more than a half of viewers are women and also majority of them are below 34 years old - that confirms many photo-shoots of the young women and their kids who bring also their husbands for the sessions ;)

The last indicator, that I found very informative and interesting, is the creative map of countries from where the views were taken:

The darkest colors - Poland and Spain, but apparently there are also views from Russia (I used to live in Moscow) and US (I started to work with US daily in my another job :)).


Of course majority of the views were done in Ireland, as everybody despite me is located there from the class, but surprisingly there were people also in Poland, US and Netherlands - who looked at my blog. I can see also that majority of you checked the blog by the mobile on Android:
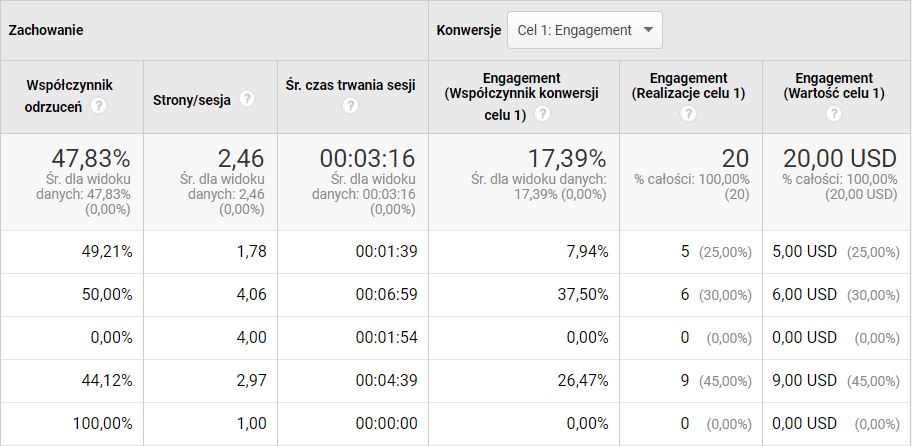
What I see that need to be worked on is the quite high bounce rate 47,83%.
Will be working on that! ;)

Bibliography:
1. https://www.benlcollins.com/dashboard/google-data-studio-tips/


Great way of presenting the list of options Marta!
ReplyDeleteGreat job, Martha!!
ReplyDeleteLove the ending!
ReplyDeleteI see you have as well some followers in Spain. Good job, Marta!
ReplyDelete