Google Analytics: Assessment of Blog Performance
 *1.)
*1.)The analysis of the performance of the blog-posts I've composed on a basis of Google Analytics tool.
It presents the period from March 9th (when we started the course) until June 20th of the current year 2020.
For comparison, I've already performed the initial analysis previously on the post "What metrics should we measure for success in Google Analytics?"*2.) using the data from this blog (the period since the beginning of the blog until until 2nd of May), but also from my Photography Website, which I've been leading longer than the current blog.
To start the full analysis, the blog has been visited mostly by the viewers from Ireland, with the result of 73,08%. This is not surprising fact, as per taking into consideration, that all the participants of the course, despite of myself are located in Ireland. On the second place ranks Poland, as I am located in Poland and I've promoted the blog among my friends on here. The other single users were located in Spain, Netherlands and US.


Looking more closely, the highest number of visitors was 19 people with 84 views of the page. In total 24 different people have read my blog with 178 views. This stresses out the importance of having this web-page in English - in the beginning the menu of the blog used to be in Polish, but I've immediately changed that, as also all my friends from Poland speak English. High number of views came also from Netherlands (higher than from Poland!), but all the time from the same user. This or anyway, nowadays the web pages has possibility of automatic translation into the language, you desire to read in.


I found also very informative and interesting the above way of presenting news- the creative map of countries from where the views were taken: the darkest colors - Ireland and Poland, as it has been mentioned before- with the highest number of views.

What about the times when the views reached the highest points? It has been mostly Mondays! Not only because we had class on Mondays, I believe, but also because this is the beginning of the new week and everybody feels relaxed (or tired) to start over again, therefore not from job- but from browsing through the internet, searching for inspiration to work ;). What I see also from this graph is that in the beginning of the blog also more users checked my blog regularly, in the middle there was a pause (long weekend holiday in the end of May, the beginning of June). In June the views became more stable and only the usual "fans" has been checking the web regularly, to finally obtain the new peak in the end of the course. To summarize the observation on this graph - it pays off to post regularly and in the beginning of the week.
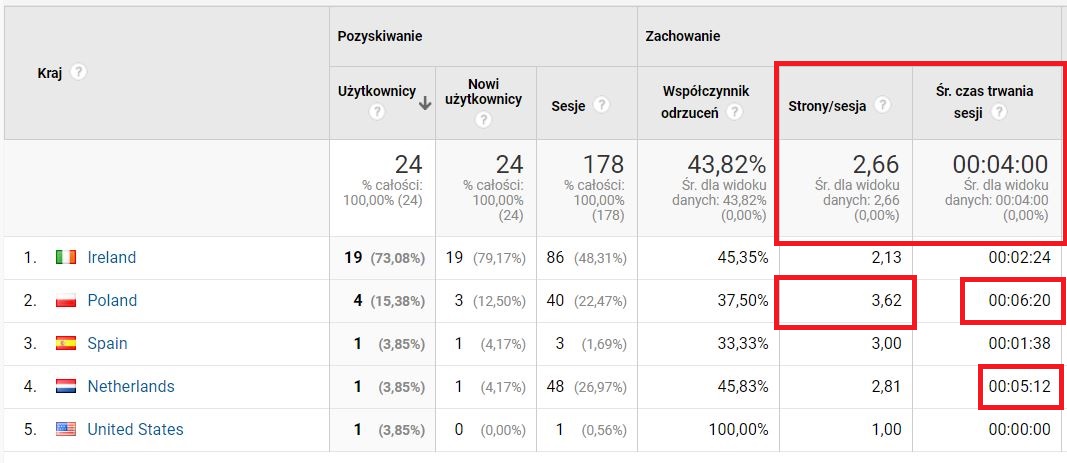
Very good information is that middle time spent on my blog was 4 minutes. That confirms that people read it ! :) The highest indicator of the number of pages seen during one session was 3,62 from Poland and longest stays on the web-site in Poland and Netherlands with more than 6 and 5 minutes!
The another fact, that attracted my attention is that the highest bounce rate was from Ireland and US, which actually is not bad news, but shows that people in Ireland have read one post per visit for almost half of the time.

The "bigger half" of the viewers of my blog were new viewers, but almost 37% of returning visitors is very good score, also taking into consideration that each user performed middling 7,42 sessions.
I believe, that promoting my blog on other websites, blogs and social media would have brought more new visitors, I will take this into consideration in the future (on my another website, that I've mention about in the post "What metrics should we measure for success in Google Analytics?- April 27, 2020", I used the social media for photographers to recommend my Photography web-page*2)).

Furthermore, as per the graph above, exactly half of the users of my blog used Windows system to check the posts, only almost quarter of the users used Android (and 8,33% iOS). Seems that the viewers prefer to sit in front of the computer and read the contents, instead of browsing by the phone, even though the blog is adapted to both - PC and Mobile view.

Moreover I have analysed also where the traffic came from in terms of channels. On the first place
ranks "Referral" as per our Moodle referral (elearning.dbs.ie), on the second place "Social" (Blogger) and in the end "Direct"- therefore maybe some people already even bookmarked my blog all in all;).


With the time, even though the number of views of the blog lowers, the conversion rate grows, because people who liked the blog start to spend there more time, I believe. My goal was that viewers will spend at least 3 minutes on my blog, and apparently from the Social viewers (Blogger), the goal has been achieved for more than 27% times.

At last I've checked which posts in particular attracted the attention of the viewers. Most of times the blog has been just quickly reviewed - probably if there are updates, new posts. On the next position ranks the first blog post with a black-white photo on the cover, which most probably was the attraction element, despite of the fact that majority of people started to red the blog from its beginning. "Creating personas", "Business model canvas" and "what metrics should I measure to success in Google Analytics are my posts enriched with photos, GIFs, etc., which for sure helped here, but despite that those topics are also most interesting in my point of view. I am surprised, that "Using Ads..." is placed in the end of the list, as many of my friends asked me actually of how the Ads works in Google. I believe that it just shows, that I should use more the "Natural" channels to promote the blog :), such as "word of mouth" marketing.
To summarize, on the basis of the above analysis during the next Blog/Website promotion I should use the following tips:
- regular posts on Mondays,
- promotions on other websites, social media and blogs,
- short posts with pictures and blogs have more views, but longer posts clarify the loyal regular viewers,
- with the time blog is receiving more conversions usually,
- traditional "word of mouth" marketing also works for increasing the blog,
- think about your audience - in terms of demographics, gender, interests to attract their attention.
 *3.)
*3.)
As it is my last post here, I would like to thank everybody who has read my blog and I hope that it has been interesting and engaging enough :).
1. https://www.getbanzai.com/resources/
2. https://marlapictures.blogspot.com/2020/04/what-metrics-should-we-measure-for.html
3. https://www.revm.com/blog/how-to-leverage-word-of-mouth-marketing-for-your-startup


Great job Marta. I like the future plans!
ReplyDelete